Troubleshooting guide#
This section provides guidance on addressing issues you may encounter while customizing the solution. It includes troubleshooting tips for common issues, as well as general instructions on debugging full-code customizations.
Troubleshoot common issues#
This section describes some common issues you may encounter when customizing the solution and how to resolve them.
General issues#
- Issues with long file paths during solution unpacking / modifications / repacking
Windows has a maximum path length of 260 characters, unless long path names are enabled explicitly on the system.
As such, if you’re using Windows, you may encounter issues with long file paths when unpacking the solution
.awafile, modifying and running the unpacked solution, or when repacking it. To avoid this, be sure to unpack the solution to a location with a short path, such asC:\temp\solution.
- Error message: “Please contact your IT admin to specify an optiSLang version in the .env file and try again”
After clicking the Start Analysis button, you may see the following error:
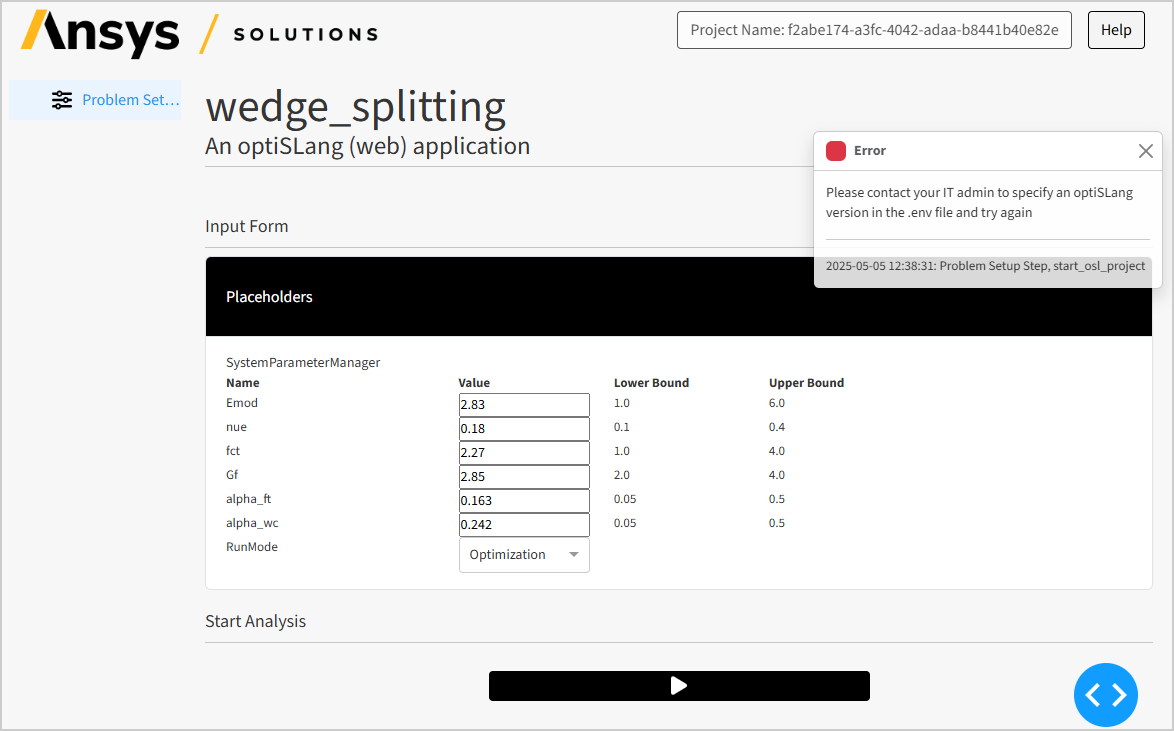
The solution requires an environment variable named
OSL_VERSIONto be defined with the optiSLang version to use, in the format of XXY, where XX is the last two digits of the year and Y is the number of the software revision. For example, for optiSLang 25R2, the variable should be defined as follows:OSL_VERSION=252
Usually, the variable is defined in the
.envfile in the solution folder and is loaded automatically when you run the solution.However, if you’re using Visual Studio Code and run the solution from the integrated PowerShell terminal, comments in the
.envfile aren’t treated correctly and some variables might not be loaded.- To address this issue:
You can either remove the comments in the
.envfile, add a line break between the affected variable and the comment, or manually define the environment variable in the terminal before running the solution. If you’re using a different IDE, be sure to check if the.envfile is loaded correctly and if the variable is defined correctly.
No-code customization issues#
- Custom image at the project title/problem-setup page or custom header logo isn’t displayed
Ensure that the image file is placed in the correct folder and that the filename is correct. For more information, see the no-code instructions for adding custom images and adding a custom header logo.
Ensure that the image format is correct.
Ensure that the image file isn’t corrupt.
- Custom text at the problem-setup page isn’t displayed or doesn’t display as expected
Ensure that the text file is placed in the correct location and that the filename is correct. For more information, see the no-code instructions for adding custom text.
If the custom text is displayed but the content isn’t shown as expected, review the Markdown syntax and file content of the custom text file (for example, with a Markdown previewer).
Low-code customization issues#
- Custom image at arbitrary locations isn’t displayed or is displayed at the wrong location
Ensure that the image file is placed in the correct folder,
src\ansys\solutions\<solution-name>\ui\assets\images\.Ensure that you added the correct image filename with the correct file extension in the
Imageenumeration in thesrc\ansys\solutions\<solution-name>\ui\utils\images.pyfile. For more information, see the low-code instructions for adding custom images.Ensure that you have added the
Image.CUSTOM_IMAGE.get_div()command in the correct location in the layout definition, whereCUSTOM_IMAGEis the name of the image in theImageenumeration.
- Custom image shown with the wrong size
Ensure that you provided the correct formatting options in the
get_div()command.- Custom text at arbitrary locations isn’t shown at all, or is shown at the wrong location
Ensure that the custom text Markdown file is placed in the correct folder,
src\ansys\solutions\<solution-name>\ui\assets\texts\.Ensure that you added the
get_custom_text()command in the correct location in the layout definition.Ensure that you provided the correct filename (with correct file extension) in the
get_custom_text()command.
- Custom text is shown, but not as expected
Ensure that the Markdown syntax (and MathJax function syntax, if used) is correct. For more information, see the low-code instructions for adding custom texts.
Full-code customizations#
- No data is shown in the app
Be aware that before clicking the Start Analysis button, optiSLang is not started and no monitoring data is available.
This also applies to the navigation tree which initially only displays static data, and in the default solution gets updated with the project tree of actors after starting optiSLang.
Even after starting optiSLang, the monitoring data and files might not be immediately available since they need to be retrieved from the optiSLang server. So it is important to cover the
no datacase properly in the code.
- Data shown in the app isn’t updating as expected
Ensure that the optiSLang project server is running and healthy (that is, the
Commandsbuttons are enabled).Verify that you’re using the correct entry of the
WebsocketStreamListenersenumeration (insrc\ansys\solutions\<solution-name>\ui\utils\websocket.py) asTriggerorInputto the callback that you’re using to update the data in the UI.If you’re certain that the callback is being called correctly and the monitoring data retrieved from the backend is being updated as expected, but the UI isn’t updating, this could be caused by a specific behavior of Dash, where callbacks can “overtake” each other:
Dash discards the response of a callback if the same callback has been triggered (and finished) again before the response of the first callback has been received.
This can happen, for example, in either of the following scenarios:
The callback is triggered multiple times in a short time span and the response takes longer than the time between the triggers.
The callback execution time varies significantly depending on the inputs.
This is especially relevant when, depending on the inputs, the callback might return
no_updateor raisePreventUpdateexceptions, and so finishes faster than when it returns a value. In this case, when ano_updateresponse is sent before the previousupdateresponse is received, theupdateresponse is discarded and the UI doesn’t change. Because of this, it is important that you avoid this scenario.
Debug your customized solution#
This section provides general instructions on how to debug your customized solution — just in case the troubleshooting advice given in the previous section isn’t sufficient.
Attention
This documentation assumes that you’re familiar with Python and the debugging tools available in your IDE.
Be sure to set up the development environment and run the solution as described in Test the changes.
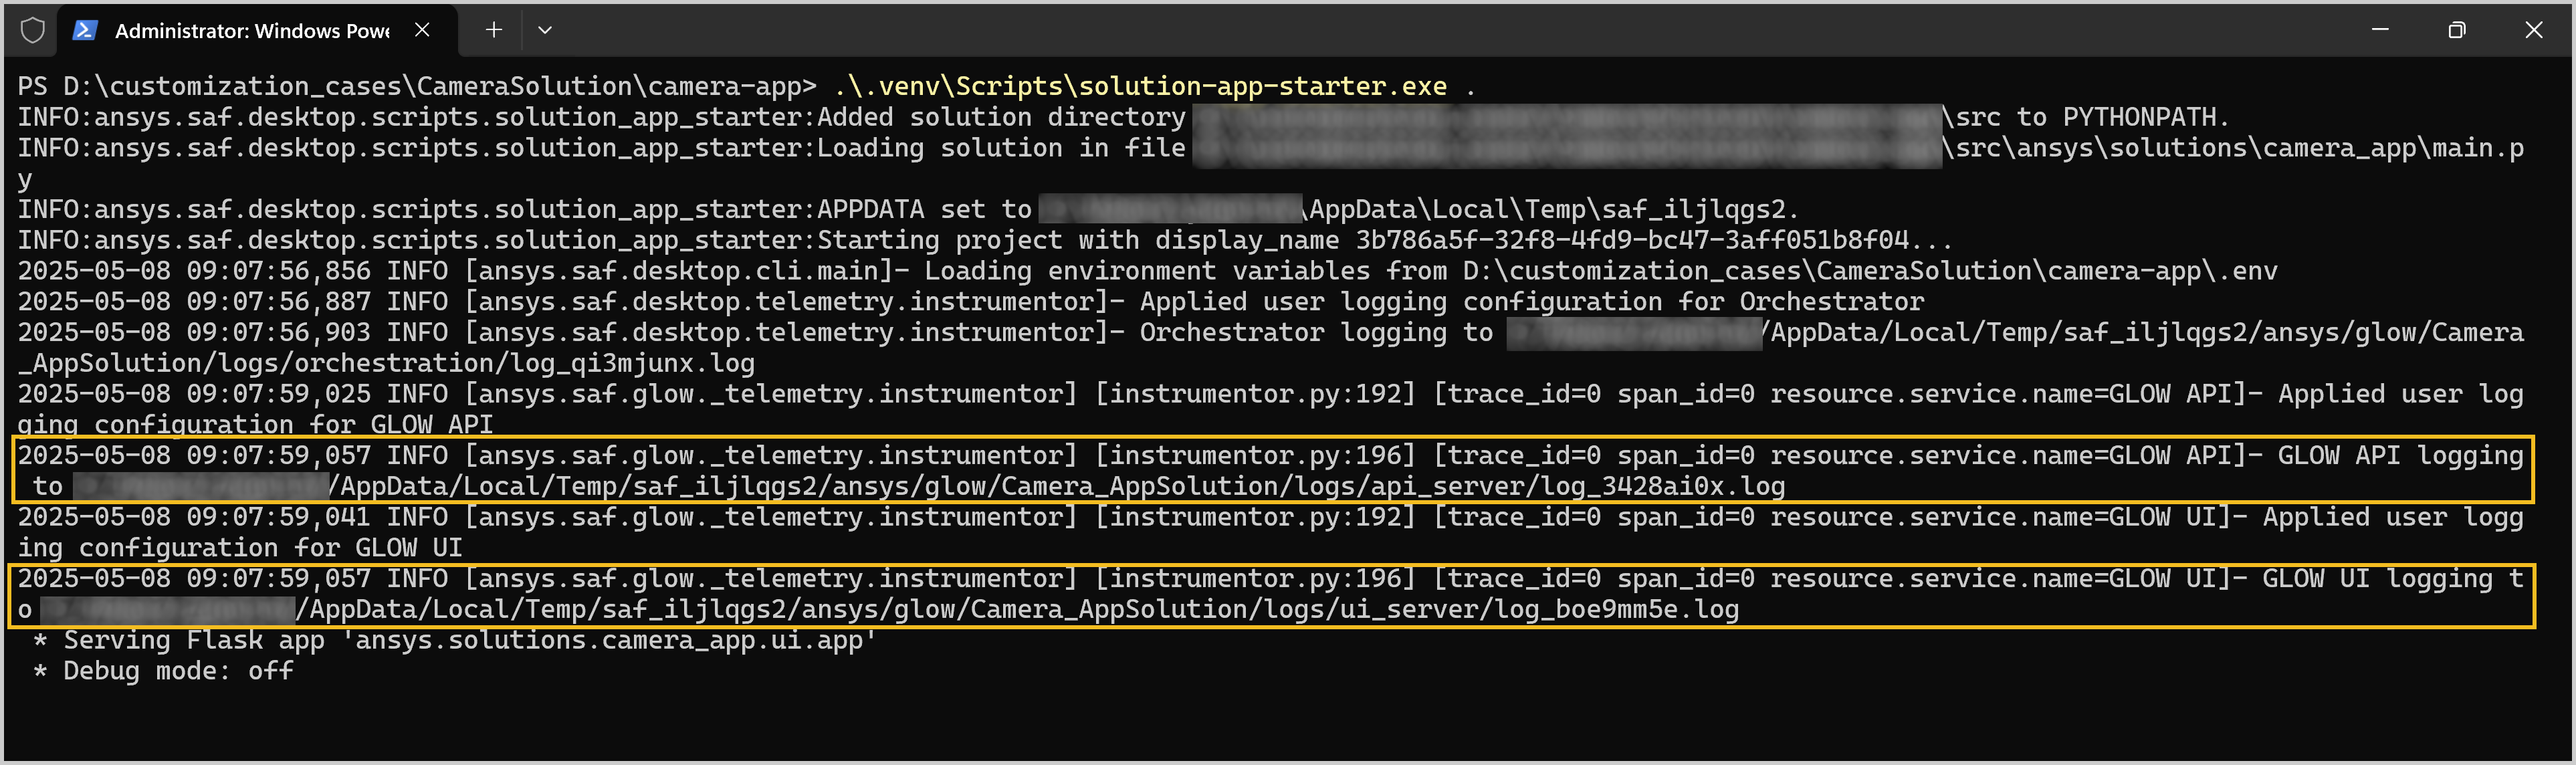
Available log files#
In the terminal where you run the solution, find the file paths to the solution logs:
Tip
If you’re using Visual Studio Code and running the solution from the integrated PowerShell terminal, you can open log files by clicking on them while pressing the Ctrl key.
For details on the most important log files, review the following list:
- UI log:
Message
GLOW UI logging to ui_log_file_path, whereui_log_file_pathis the path to the UI log fileLogs errors, warnings, and info messages from the UI side
Dash callback errors are logged here
- Backend/API log:
Message
GLOW API logging to api_log_file_path, whereapi_log_file_pathis the path to the API log fileLog errors, warnings, and info messages from the backend, except from long-running methods (see the following entries for specific logs)
Normally shouldn’t be needed when not modifying the backend
- Specific log for startup of optiSLang:
Message
GLOW METHOD RUNNER logging to base_log_file_path/long_running_methods/log_start_osl_project_XXXXXXXX.log, wherebase_log_file_pathis the path to the folder containing all log files andXXXXXXXXis a unique identifier for the log fileLogs errors, warnings, and info messages that occur when starting optiSLang
Could be useful to check if having trouble starting optiSLang
- Specific logs for backend data and result file monitoring:
Message
GLOW METHOD RUNNER logging to base_log_file_path/long_running_methods/log_update_data_XXXXXXXX.logand others, wherebase_log_file_pathis the path to the folder containing all log files andXXXXXXXXis a unique identifier for the log fileLogs errors, warnings, and info messages that occur when monitoring data and result files
Normally, this shouldn’t be needed when not modifying the backend
Tip
To enable additional debug output in the log files, add the variable GLOW_LOGGING_LEVEL=DEBUG in the .env file before running the solution.
Debugging options#
Use print statements#
You can use print statements to log information to the terminal where you run the solution. This is useful for simple debugging purposes, but should be removed in production code.
Run the solution UI in a browser#
When you run the solution on Linux, the run_solution command requires you to open the UI in a browser always. This is useful for debugging purposes, as you can use the browser developer tools to inspect the UI layout, Dash callback calls, and websocket streams.
To open the UI in a browser on Windows, follow these steps:
Run the
run_solutioncommand as usual.Open the UI log and search for the line
Running GLOW UI server on http://host:port, wherehostis the IP address of the machine andportis the port number.In the UI log, search for the line
"GET /projects/project_id HTTP/1.1" 200.The
project_idis the ID of the project that is being opened in the UI.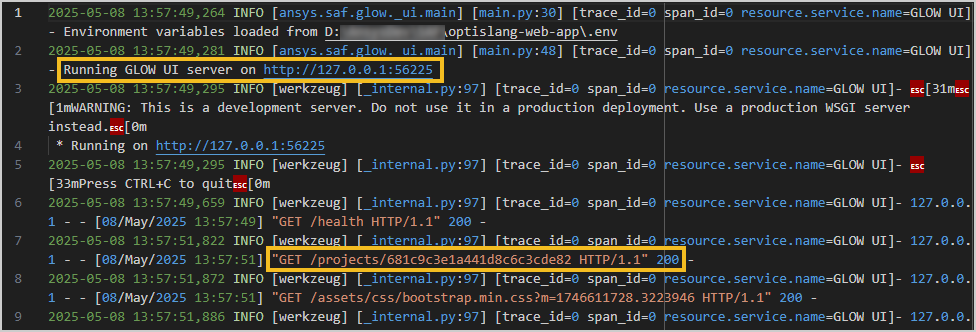
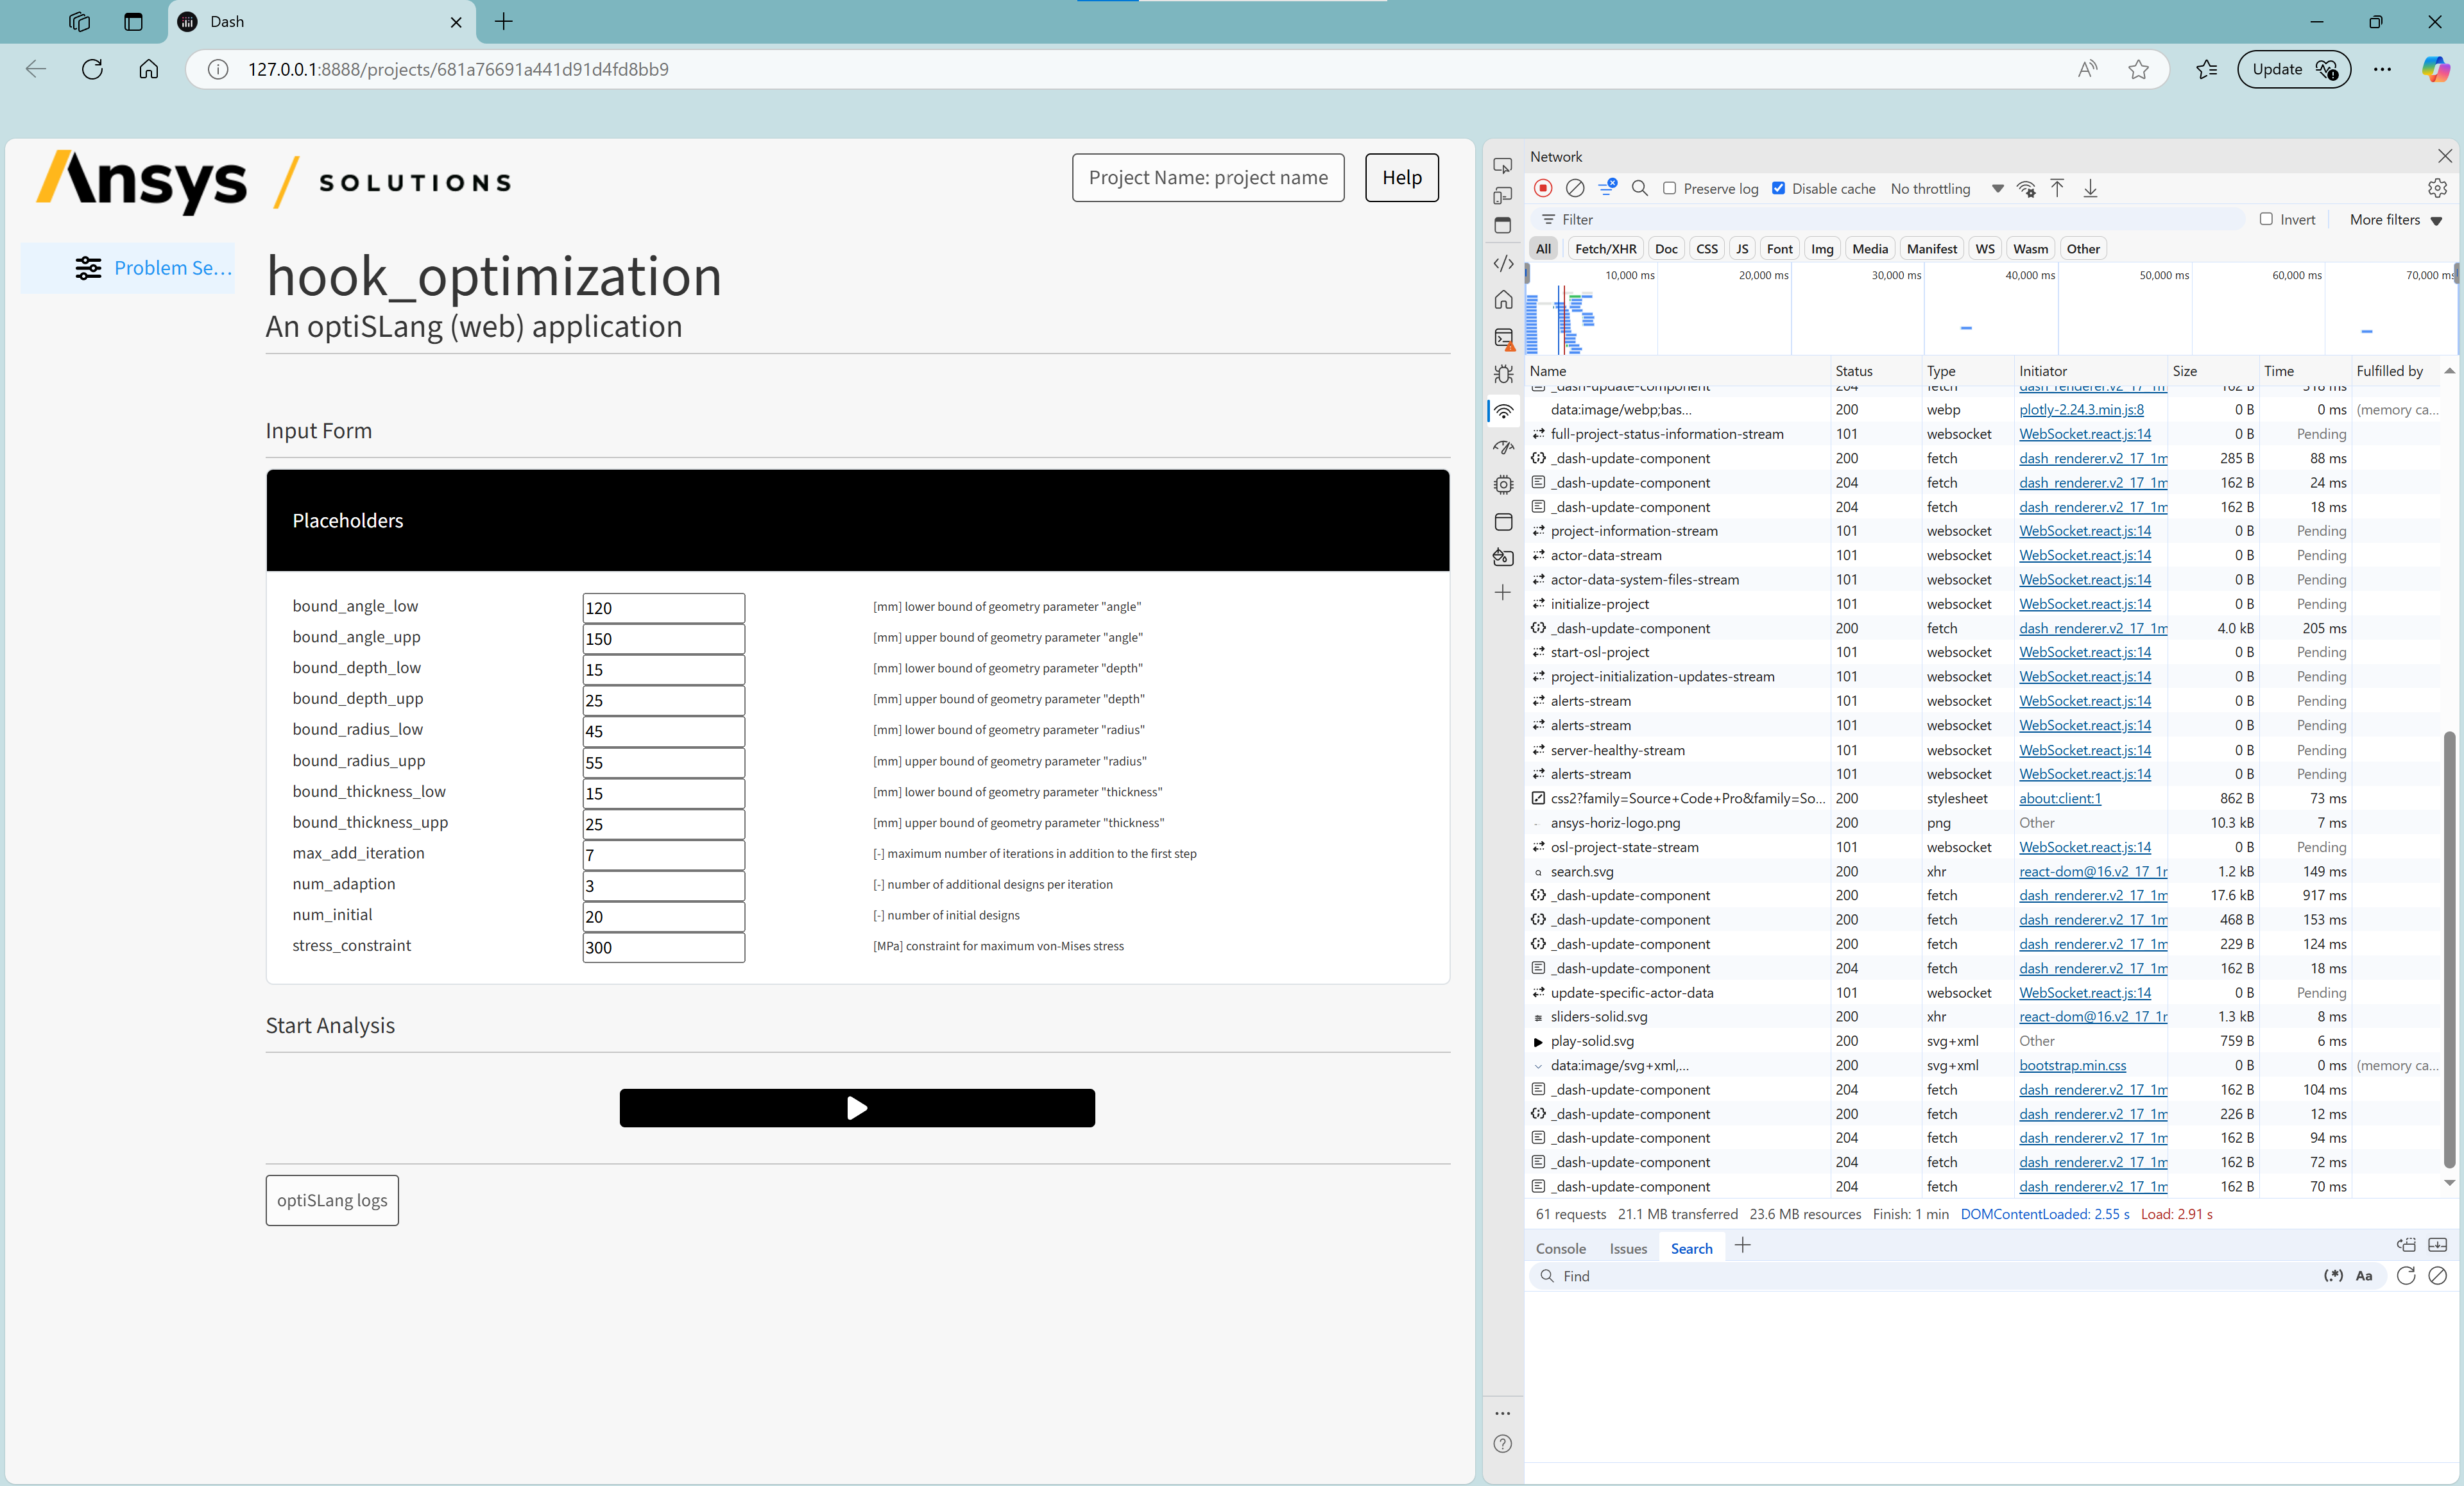
Open a web browser and enter the URL
http://host:port/projects/project_id.This opens the UI in the browser, where you can use the developer tools (usually by pressing the F12 key) to inspect the UI layout, Dash callback calls, and websocket streams.
Note
You need to keep the normal solution window open while debugging, since both the UI and the backend are shut down when you close the solution window.
Enable debug mode#
You can enable the general debug mode or the UI debug mode.
- General debug mode:
Set the variable
GLOW_DEBUG=Truein the.envfile before running the solution.This allows you to attach a debugger to the backend code.
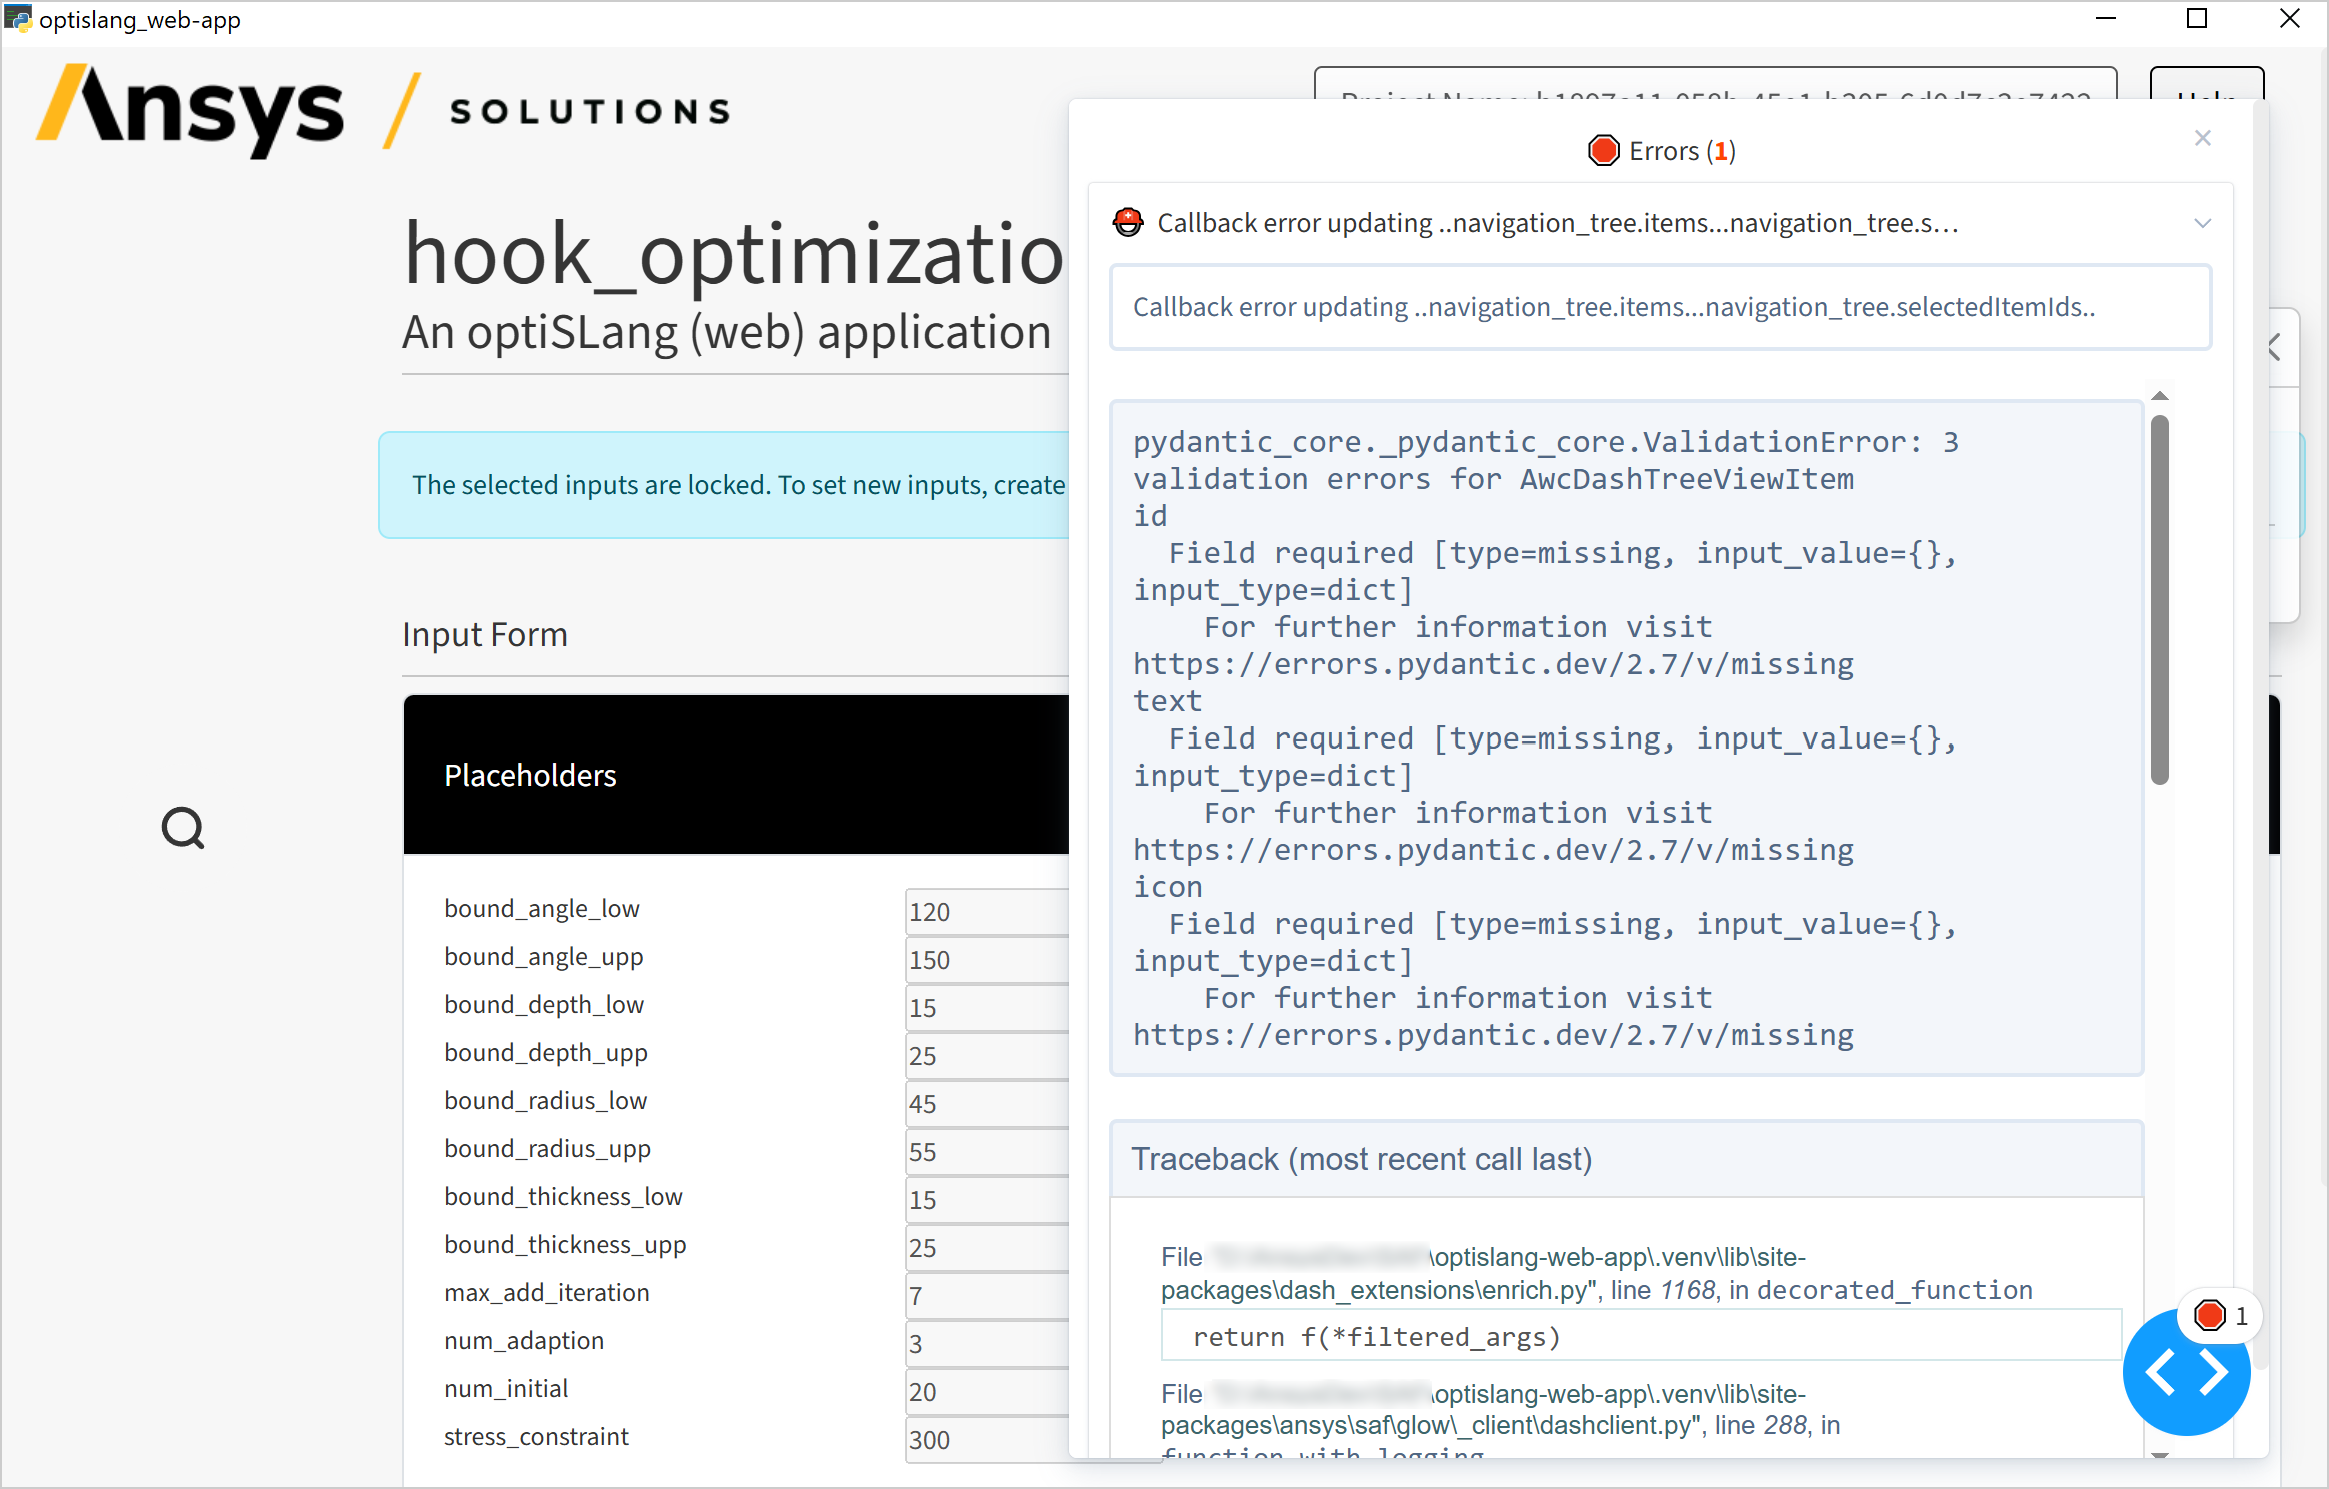
This runs Dash in debug mode, which enables hot reloading of the UI code (that is, changes to the UI code are automatically applied without restarting the UI server) and provides details in case of a callback error directly in the UI:
- Debug mode for the UI:
Set the variable
GLOW_UI_PYTHON_DEBUGGING=1in the.envfile before running the solution.This allows you to attach a debugger to the UI code (Dash callbacks).
For more information about the different debug modes and how to attach to the solution with a debugger, see Debugging in the Ansys Solutions developer’s guide.