Full-code customization tutorial: Bolt app#
This tutorial shows how to create a full code customization of the web app. It is intended for advanced users for whom the default customization options are not sufficient.
Note
This tutorial assumes that you have some knowledge of Python and the Python-based UI framework, Dash. For information on Dash, see the Dash documentation.
- Code:
You can access the full code at the end of this document or download it
here.- Project:
You can download the optiSLang project used in this tutorial
here.The simplified tutorial project consists of nodes that run Python code to generate values of allowable bolt forces and stresses for each given design point, where each design point has parameters for bolt class, bolt diameter, and safety factor.
Attention
This project should be used only to demonstrate the customization of the UI. Do not use it for any real calculations.
- Customized UI:
When you complete this tutorial, the customized UI will look like this:
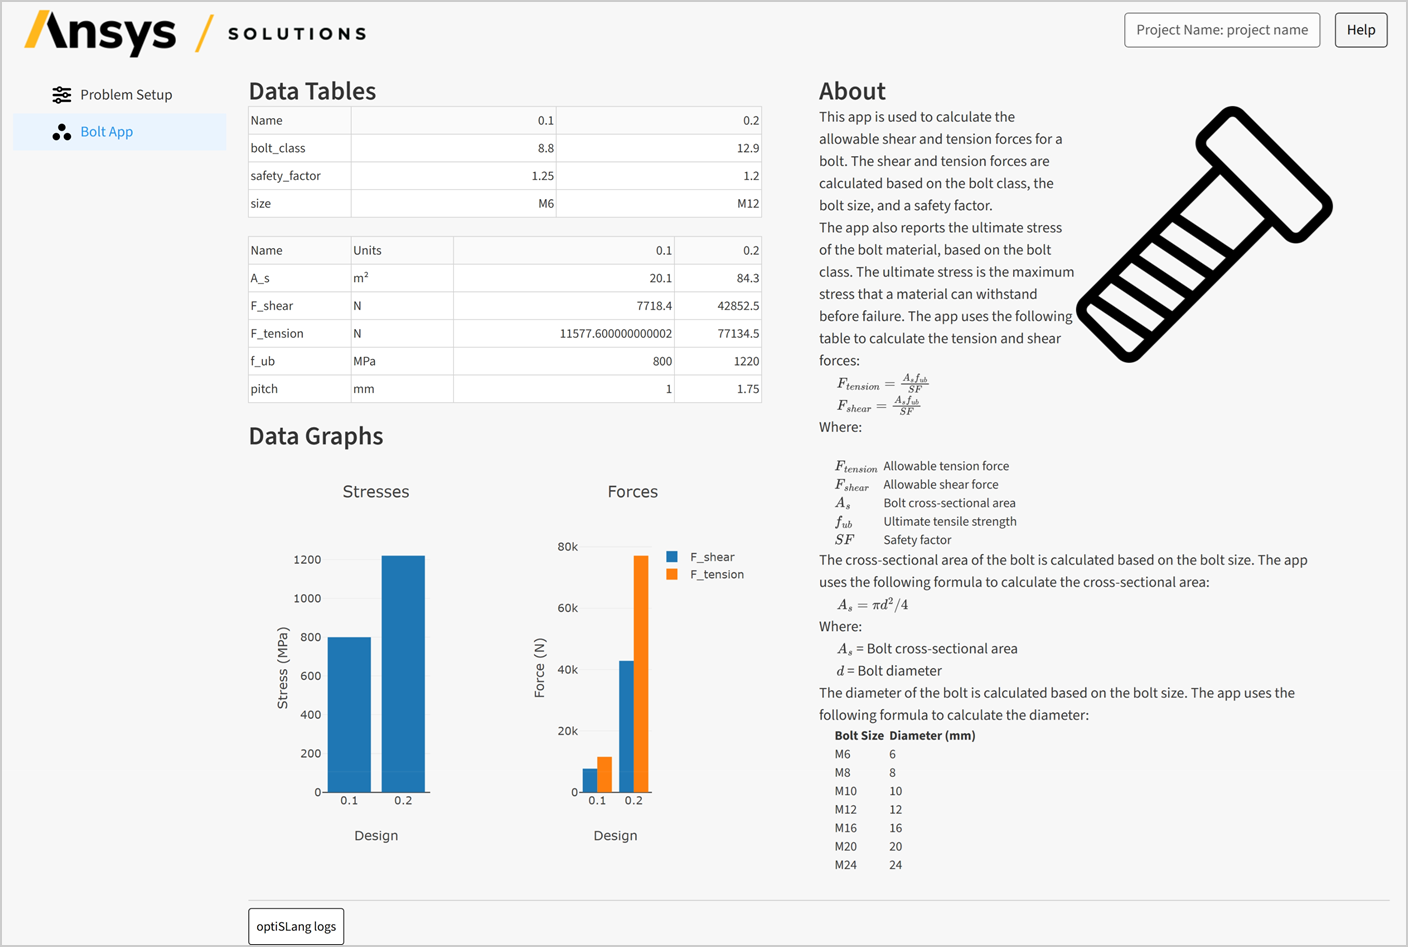
In the final customized UI, you can see that:
There are two tables, one with the parameters and one with the responses, for each design point.
There are two bar charts, one with the stress response values and one with the force values.
On the right side, there is a markdown text with information about the calculations and a custom image.
The following sections describe how to create this custom UI step by step, starting from the default example solution created from the supplied optiSLang project.
Create the default solution#
The first step is to create a new solution from the supplied optiSLang project Bolt_App.opf:
Open the project in optiSLang and save it as Ansys Web App.
Set up the development environment as described in Test the changes.
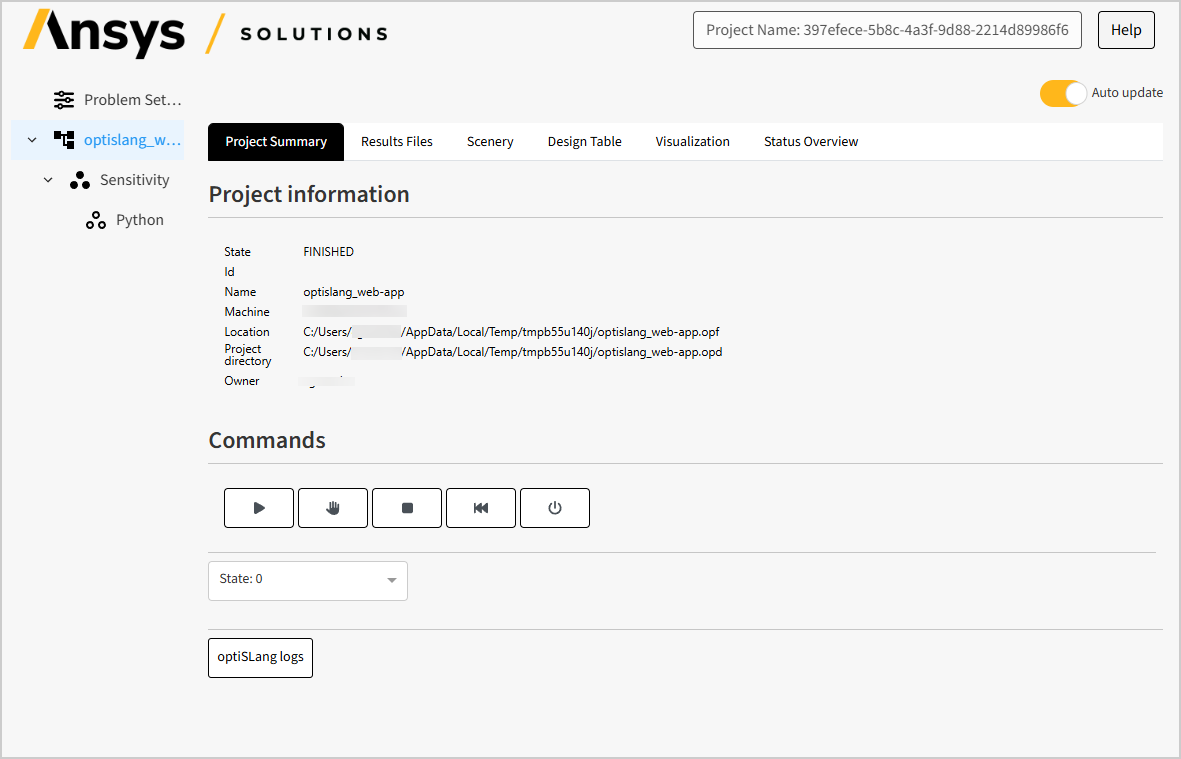
When you run this default solution, it looks like this:
Add a custom image#
Add a custom image to be used in the page.
- Add the image.
Download
bolt.pngfile from herehere.Add the image to the folder
src\ansys\solutions\bolt_app\ui\assets\images.
- Add the image to the
Imageclass. Open the file
src\ansys\solutions\bolt_app\ui\utils\images.py.Add the following line, making sure that the filename is the same as the name of the file you added:
class Image(Enum):
    """Enumeration of images used in the solution.
    If you for example need to change the name of the project title, you can change it here.
    """

    ABOUT = "about.png"
    ABOUT_PLACEHOLDERS = "about-placeholders.png"
    BOLT = "bolt.png"
- Add the image to the
This adds a new image to the Image class so it can be used in the layout.
Tip
If you want to use the image in the tree view, you can add it to the Icons class, as described in the
camera example.
Update the tree view#
Add the Bolt app to the tree view and remove the default monitoring pages.
- Import the app layout.
Open the file
src/ansys/solutions/bolt_app/ui/pages/page.py.Add the following line:
from ansys.solutions.bolt_app.ui.components import event_listeners
from ansys.solutions.bolt_app.ui.customization import bolt_app
from ansys.solutions.bolt_app.ui.pages import monitoring_page, problem_setup_page
Note
Note that
create ansys.solutions.bolt_app.ui.customization.bolt_appisn’t yet created. This happens later, when you create the app layout.
- Add the app to the tree view.
Add a new item to the
get_treeview_itemsfunction so the item is displayed in the navigation tree.For a more detailed explanation, see the camera tutorial.
def get_treeview_items(project: Bolt_AppSolution) -> list[dict]:
    """Get the treeview items for the navigation tree."""

    problem_setup_step_item = AwcDashTreeViewItem(
        id="problem_setup_step",
        text="Problem Setup",
        icon=Icon.SETTINGS,
    )

    tree_items = [problem_setup_step_item]

-  osl_project_tree = DataAccess(project).get_project_tree()
-
-  if not osl_project_tree.is_uninitialized:
-      tree_items.append(AwcDashTreeViewItem.from_actor_tree_node(osl_project_tree))
+  if DataAccess(project).get_osl_instance_started():
+      bolt_app_item = AwcDashTreeViewItem(
+          id="bolt_app",
+          text="Bolt App",
+          icon=Icon.SYSTEM,
+      )
+      tree_items.append(bolt_app_item)

    return AwcDashTreeView(tree_items=tree_items).create()
- Display the app when clicked.
Update the
get_page_layout_by_clicked_tree_itemfunction to display the Bolt app when the item is clicked in the navigation tree.Check if the
clicked_tree_item_idisbolt_app. If so, it should return the app layout.85 if DataAccess(project).get_osl_instance_started(): 86 bolt_app_item = AwcDashTreeViewItem( 87 id="bolt_app", 88 text="Bolt App", 89 icon=Icon.SYSTEM, 90 ) 91 92 tree_items.append(bolt_app_item) 93 94 return AwcDashTreeView(tree_items=tree_items).create() 95 96 97def get_page_layout_by_clicked_tree_item(clicked: str | None, project: Bolt_AppSolution) -> html.Div: 98 """Get the page layout for the clicked tree item.""" 99 if clicked is None: 100 return html.Div(html.H1("Welcome!")) 101 elif clicked == "problem_setup_step": 102 return problem_setup_page.layout(project) 103 elif clicked == "bolt_app": 104 return bolt_app.layout 105 else: 106 return monitoring_page.layout(selected_actor=clicked, project=project)
Create the app layout#
Create the layout for the Bolt app.
- Create the app layout file.
In the folder
src/ansys/solutions/bolt_app/ui, create a folder namedcustomization.In this folder, create a file named
bolt_app.py.Open the file for editing.
- Add the imports.
Add the imports to be used in the app:
 3from dash_extensions.enrich import Output, State, Trigger, dash_table, dcc, html
 4import pandas as pd
 5
 6from ansys.saf.glow.client import DashClient, callback
 7from ansys.solutions.bolt_app.datamodel.shared.models import ActorAndHid, DesignFields
 8from ansys.solutions.bolt_app.datamodel.shared.websocket_streams import WebsocketStreamListeners
 9from ansys.solutions.bolt_app.solution.data_access import DataAccess
10from ansys.solutions.bolt_app.solution.definition import Bolt_AppSolution
11from ansys.solutions.bolt_app.ui.utils.images import Image
Note
If you use the case built from the supplied project, the namespace is
ansys.solutions.bolt_appand the solution name isBolt_AppSolution.These names are derived from the name of the solution
.awafile, so you need to adjust them when the solution has been created from a different optiSLang project or when you specified a different filename during the solution creation process.You can use the imports in
src/ansys/solutions/bolt_app/ui/pages/page.pyas a reference to find the correct names.
- Define the variables.
Define the following variables to be used in the app:
64UNITS = {
65    "A_s": "m²",
66    "F_shear": "N",
67    "F_tension": "N",
68    "f_ub": "MPa",
69    "pitch": "mm",
70}
71
72FORCE_RESPONSES = ["F_shear", "F_tension"]
73STRESS_RESPONSES = ["f_ub"]
- Define the page text and image.
On the next lines, some markdown text is defined in the
textvariable. This text is put into the layout using adcc.Markdown— in this case, withmathjax=Trueto support display of the included equations. The custom image defined previously is also included.Place these as the content on the right side of the layout:
75image = Image.BOLT.get_div(style={"width": "50%", "float": "right"})
76
77right_content = [
78    html.H4("About"),
79    html.P([image, dcc.Markdown(text, mathjax=True)]),
80]
- Add the tables.
In the customized app, there are to be two tables for each design point: Parameters and Responses.
Create these tables using the standard
dash_table.DataTable:87PLACEHOLDER_DATA_COLUMNS = [{"name": "", "id": ""}] 88PLACEHOLDER_DATA = [{"": "No data available"}] 89 90parameter_table = dash_table.DataTable( 91 id="parameters_table", data=PLACEHOLDER_DATA, style_cell_conditional=style_cell_conditional 92) 93responses_table = dash_table.DataTable( 94 id="responses_table", data=PLACEHOLDER_DATA, style_cell_conditional=style_cell_conditional 95)
Note
At the moment, these tables are just placeholders which don’t contain any data. The data is to be filled in by callbacks at a later stage, as described in Add the callbacks.
- Add the bar charts.
In the customized app, there are to be two bar charts: Stresses (with stress response values) and Forces (with force values).
Create these charts using the
dcc.Graphclass, then define a flex container so the charts are shown in a single row:97GRAPH_LAYOUT = {"plot_bgcolor": "rgba(0,0,0,0)", "paper_bgcolor": "rgba(0,0,0,0)"} 98GRAPH_STYLE = {"width": "100%"} 99HIDDEN_GRAPH_STYLE = {**GRAPH_STYLE, "display": "none"} 100 101parameter_graph = dcc.Graph(id="parameter-graph", style=HIDDEN_GRAPH_STYLE, responsive=True) 102response_graph = dcc.Graph(id="responses-graph", style=HIDDEN_GRAPH_STYLE, responsive=True) 103 104graph_holder = html.Div( 105 [parameter_graph, response_graph], style={"display": "flex", "flex-direction": "row", "size": "100%"} 106)
- Place the content.
Place the tables and the bar chart container as the content on the left side of the layout, with a Data Tables heading for the tables and a Data Graphs heading for the bar charts:
108left_content = [ 109 html.H4("Data Tables"), 110 parameter_table, 111 html.Br(), 112 responses_table, 113 html.Br(), 114 html.H4("Data Graphs"), 115 graph_holder, 116]
- Add the page layout.
Assemble the page layout using four
divelements that contain the tables, charts, and other components:118left_side = html.Div(left_content, style={"display": "flex", "flex-direction": "column", "width": "45%"}) 119divider = html.Div(style={"display": "flex", "flex-direction": "column", "width": "5%"}) 120right_side = html.Div(right_content, style={"display": "flex", "flex-direction": "column", "width": "45%"}) 121 122layout = html.Div([left_side, divider, right_side], style={"display": "flex", "flex-direction": "row"})
Add the callbacks#
The tables are now added to the layout, but they don’t yet contain any data. Create the callbacks to fill in and update the data used in the tables.
- Add the parameters table callback.
Create a callback to update the Parameters table:
125@callback( 126 Output("parameters_table", "data"), 127 Output("parameters_table", "columns"), 128 Trigger(WebsocketStreamListeners.ACTOR_DATA.value, "message"), 129 State("url", "pathname"), 130) 131def update_parameter_table(pathname): 132 project = DashClient[Bolt_AppSolution].get_project(pathname) 133 data_access = DataAccess(project) 134 osl_project_tree = data_access.get_project_tree() 135 136 if osl_project_tree.is_uninitialized: 137 return PLACEHOLDER_DATA, PLACEHOLDER_DATA_COLUMNS 138 139 actors = osl_project_tree.find_nodes_by_name("Sensitivity") 140 141 if not actors: 142 return PLACEHOLDER_DATA, PLACEHOLDER_DATA_COLUMNS 143 144 actor = actors[0] 145 hids = data_access.monitoring_data.get_actor_states_ids(actor.uid) 146 147 if not hids.states_ids: 148 # No data available yet 149 return PLACEHOLDER_DATA, PLACEHOLDER_DATA_COLUMNS 150 151 actor_and_hid = ActorAndHid(actor_uid=actor.uid, hid=hids.states_ids[0]) 152 design_points = data_access.monitoring_data.get_design_points(actor_and_hid) 153 parameter_data = design_points.to_dict_by_states(DesignFields.PARAMETERS) 154 parameter_frame = pd.DataFrame(parameter_data) 155 return parameter_frame.to_dict("records"), [{"name": i, "id": i} for i in parameter_frame.columns]
About this code:
The callback is triggered by the
WebsocketStreamListeners.ACTOR_DATAstream, which triggers when the actor data is updated on the backend.Using the
project, aDataAccessobject is created, which allows for retrieval of the optiSLang project tree and the design points. If the project tree is uninitialized, an empty table is returned.The project is checked for an actor with the name “Sensitivity.” If it is not found, an empty table is returned. There is also a check for whether there are states. (Normally, this is a list with a single element containing
0.) If there are no states, an empty table is returned.Using the unique identifier and state of the actor, the design point data for the actor is obtained. Using this object, a dict with the data is obtained using the
to_dict_by_statesmethod. By specifyingDesignFields.PARAMETERSit is ensured that only the values for the parameters are returned.The design point data for the actor is obtained using the unique identifier and state of the actor. Using this object, a dict with the data is obtained using the
to_dict_by_statesmethod. SpecifyingDesignFields.PARAMETERS, ensures that only the values for the parameters are returned.The
to_dict_by_statesmethod returns a dict with the states as keys and the parameters as values.
Lastly, the dict is converted to a pandas data frame and returns it as a dict using the
to_dictmethod with the argumentorient="records". This returns a list of dict, which is the format expected by theDataTable.
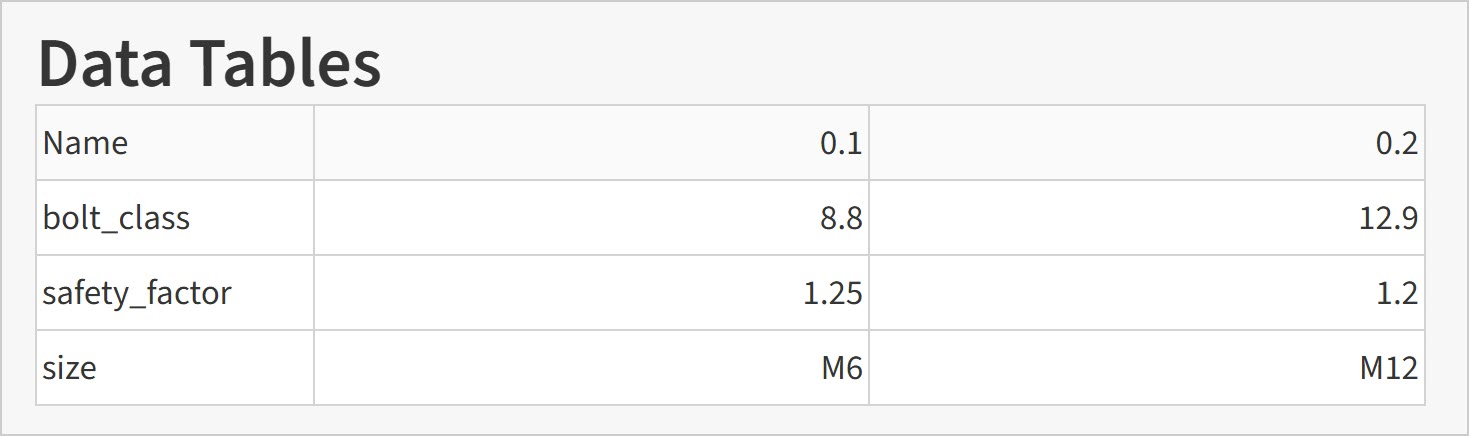
This results in the following table:
- Add the response table callback.
Create a callback to update the Response table:
158@callback( 159 Output("responses_table", "data"), 160 Output("responses_table", "columns"), 161 Trigger(WebsocketStreamListeners.ACTOR_DATA.value, "message"), 162 State("url", "pathname"), 163) 164def update_response_table(pathname): 165 project = DashClient[Bolt_AppSolution].get_project(pathname) 166 data_access = DataAccess(project) 167 osl_project_tree = data_access.get_project_tree() 168 169 if osl_project_tree.is_uninitialized: 170 return PLACEHOLDER_DATA, PLACEHOLDER_DATA_COLUMNS 171 172 actors = osl_project_tree.find_nodes_by_name("Sensitivity") 173 174 if not actors: 175 return PLACEHOLDER_DATA, PLACEHOLDER_DATA_COLUMNS 176 177 actor = actors[0] 178 hids = data_access.monitoring_data.get_actor_states_ids(actor.uid) 179 180 if not hids.states_ids: 181 # No data available yet 182 return PLACEHOLDER_DATA, PLACEHOLDER_DATA_COLUMNS 183 184 actor_and_hid = ActorAndHid(actor_uid=actor.uid, hid=hids.states_ids[0]) 185 design_points = data_access.monitoring_data.get_design_points(actor_and_hid) 186 187 response_names = design_points.get_field_names(DesignFields.RESPONSES) 188 response_data = design_points.to_dict_by_states(DesignFields.RESPONSES) 189 response_frame = pd.DataFrame(response_data) 190 # Insert the units of measure 191 response_frame.insert(1, "Units", [UNITS.get(field_name, "") for field_name in response_names]) 192 return response_frame.to_dict("records"), [{"name": i, "id": i} for i in response_frame.columns]
About this code:
This callback is very similar to the parameter table callback, except that it uses the
DesignFields.RESPONSESargument to get the values for the responses.Also, a new column with the units is added. This is obtained from the
UNITSdict, using as keys the response names fromget_field_names.A new column with the units is added. This is obtained from the
UNITSdict, using as keys the response names fromget_field_names.
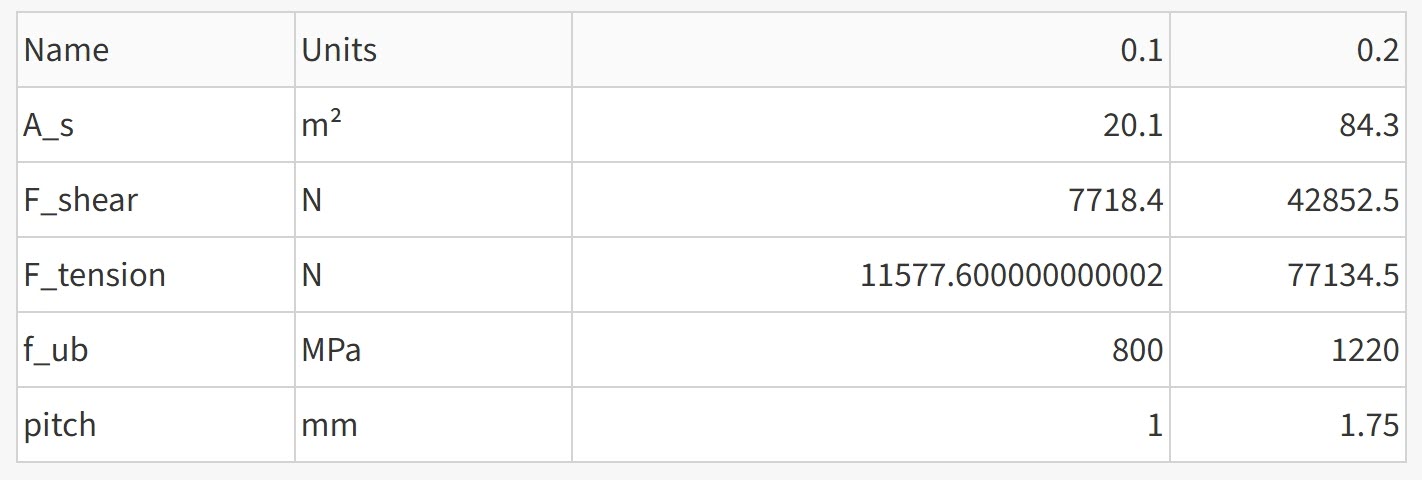
This results in the following table, which has the units added to it:
- Add the stress chart callback.
Create a callback to update the bar chart with stress values:
195@callback( 196 Output("parameter-graph", "figure"), 197 Output("parameter-graph", "style"), 198 Trigger(WebsocketStreamListeners.ACTOR_DATA.value, "message"), 199 State("url", "pathname"), 200) 201def update_stress_graph(pathname): 202 project = DashClient[Bolt_AppSolution].get_project(pathname) 203 data_access = DataAccess(project) 204 osl_project_tree = data_access.get_project_tree() 205 206 if osl_project_tree.is_uninitialized: 207 return {}, HIDDEN_GRAPH_STYLE 208 209 actors = osl_project_tree.find_nodes_by_name("Sensitivity") 210 211 if not actors: 212 return {}, HIDDEN_GRAPH_STYLE 213 214 actor = actors[0] 215 hids = data_access.monitoring_data.get_actor_states_ids(actor.uid) 216 217 if not hids.states_ids: 218 # No data available yet 219 return {}, HIDDEN_GRAPH_STYLE 220 221 actor_and_hid = ActorAndHid(actor_uid=actor.uid, hid=hids.states_ids[0]) 222 design_points = data_access.monitoring_data.get_design_points(actor_and_hid) 223 data = design_points.to_dict_by_keys(DesignFields.RESPONSES) 224 states = design_points.get_states() 225 data = [ 226 { 227 "x": states, 228 "y": data[field_name], 229 "type": "bar", 230 "name": field_name, 231 } 232 for field_name in STRESS_RESPONSES 233 ] 234 layout = { 235 **GRAPH_LAYOUT, 236 "title": "Stresses", 237 "xaxis": {"title": "Design", "tickmode": "array", "tickvals": states, "ticktext": states}, 238 "yaxis": {"title": "Stress (MPa)"}, 239 } 240 figure = {"data": data, "layout": layout} 241 return figure, GRAPH_STYLE
About this code:
The first part, up until the creation of the
design_points, is similar to the previous callbacks.From the
design_p*ointsthe data is extracted, but this time theto_dict_by_keysmethod is used, which returns a dict with the response names as keys and the states as values.For the charts, an entry is created for every field defined in
STRESS_RESPONSES, (here onlyf_ub).The data is extracted from the
design_points, but in this case, theto_dict_by_keysmethod is used to return a dict with the response names as keys and the states as values. The states are used as the x axis, and the values corresponding state is used for y.
The layout of the chart is defined with the title and tick marks.
This results in the following chart. Note that for the response
f_ub, it has two states on the x axis and only one value per state.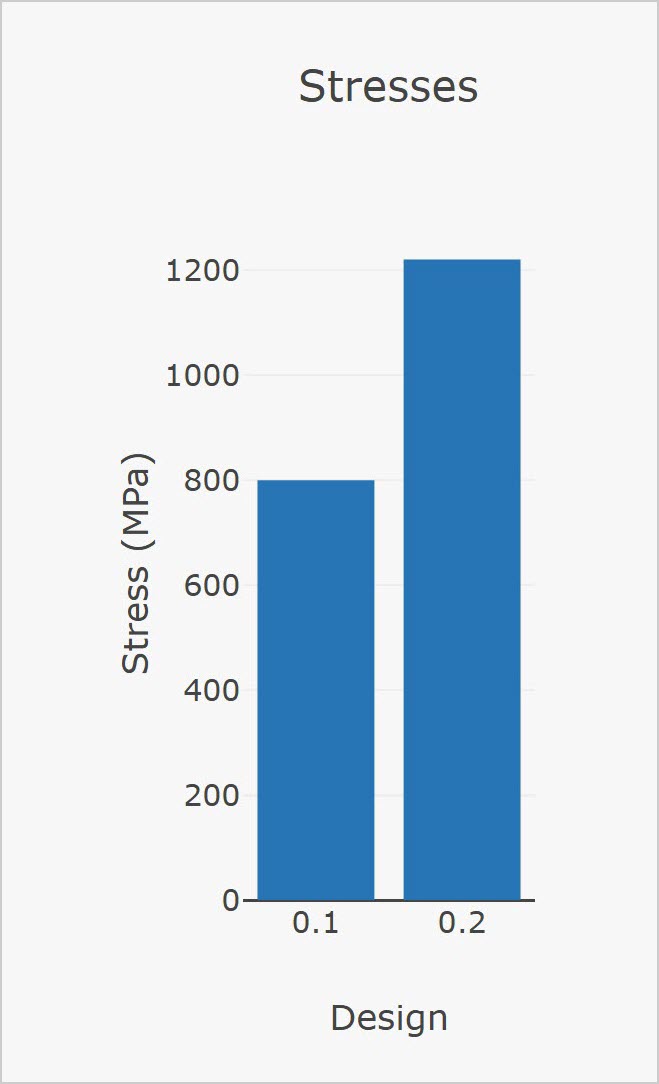
- Add the force chart callback.
Create a callback to update the bar chart with force values:
244@callback( 245 Output("responses-graph", "figure"), 246 Output("responses-graph", "style"), 247 Trigger(WebsocketStreamListeners.ACTOR_DATA.value, "message"), 248 State("url", "pathname"), 249) 250def update_responses_graph(pathname): 251 project = DashClient[Bolt_AppSolution].get_project(pathname) 252 data_access = DataAccess(project) 253 osl_project_tree = data_access.get_project_tree() 254 255 if osl_project_tree.is_uninitialized: 256 return {}, HIDDEN_GRAPH_STYLE 257 258 actors = osl_project_tree.find_nodes_by_name("Sensitivity") 259 260 if not actors: 261 return {}, HIDDEN_GRAPH_STYLE 262 263 actor = actors[0] 264 hids = data_access.monitoring_data.get_actor_states_ids(actor.uid) 265 266 if not hids.states_ids: 267 # No data available yet 268 return {}, HIDDEN_GRAPH_STYLE 269 270 actor_and_hid = ActorAndHid(actor_uid=actor.uid, hid=hids.states_ids[0]) 271 design_points = data_access.monitoring_data.get_design_points(actor_and_hid) 272 data = design_points.to_dict_by_keys(DesignFields.RESPONSES) 273 states = design_points.get_states() 274 data = [ 275 { 276 "x": states, 277 "y": data[field_name], 278 "type": "bar", 279 "name": field_name, 280 } 281 for field_name in FORCE_RESPONSES 282 ] 283 layout = { 284 **GRAPH_LAYOUT, 285 "title": "Forces", 286 "xaxis": {"title": "Design", "tickmode": "array", "tickvals": states, "ticktext": states}, 287 "yaxis": {"title": "Force (N)"}, 288 } 289 figure = {"data": data, "layout": layout} 290 return figure, GRAPH_STYLE
About this code:
This callback is similar to the previous one, except that it uses the
FORCE_RESPONSESlist (F_shearandF_tension) to get the values for the forces.
This results in the following chart. Note that for the responses
F_shearandF_tension, there are two states on the x axis and two values per state.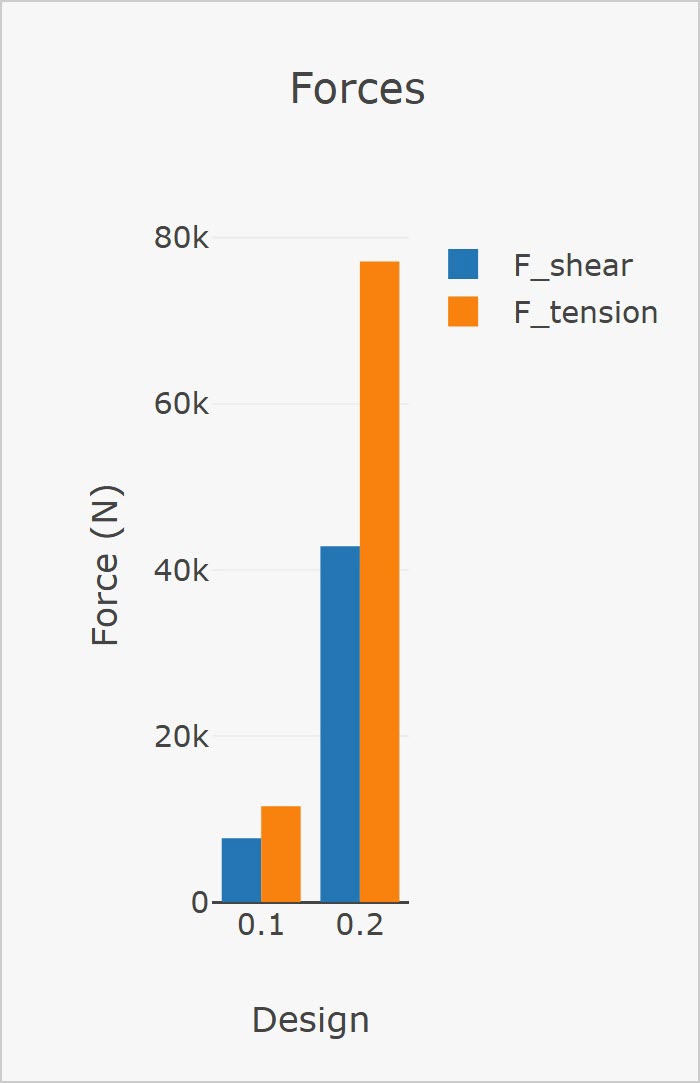
Full code#
Here is the full code for the Bolt app after the customizations are complete:
1# ©2025, ANSYS Inc. Unauthorized use, distribution or duplication is prohibited.
2
3from dash_extensions.enrich import Output, State, Trigger, dash_table, dcc, html
4import pandas as pd
5
6from ansys.saf.glow.client import DashClient, callback
7from ansys.solutions.bolt_app.datamodel.shared.models import ActorAndHid, DesignFields
8from ansys.solutions.bolt_app.datamodel.shared.websocket_streams import WebsocketStreamListeners
9from ansys.solutions.bolt_app.solution.data_access import DataAccess
10from ansys.solutions.bolt_app.solution.definition import Bolt_AppSolution
11from ansys.solutions.bolt_app.ui.utils.images import Image
12
13#   is used to add a space in the markdown text
14
15text = """
16This app is used to calculate the allowable shear and tension forces for a bolt. The shear and tension forces are
17calculated based on the bolt class, the bolt size, and a safety factor.
18
19The app also reports the ultimate stress of the bolt material, based on the bolt class. The ultimate stress is the
20maximum stress that a material can withstand before failure. The app uses the following table to calculate the
21tension and shear forces:
22
23      $F_{tension} = \\frac{A_s f_{ub}}{SF}$
24
25      $F_{shear} = \\frac{A_s f_{ub}}{SF}$
26
27Where:
28
29|   |   |
30| ----------------------------------|-------------------------------------|
31|       $F_{tension}$ |   Allowable tension force |
32|       $F_{shear}$ |   Allowable shear force |
33|       $A_s$ |   Bolt cross-sectional area |
34|       $f_{ub}$ |   Ultimate tensile strength |
35|       $SF$ |   Safety factor |
36
37The cross-sectional area of the bolt is calculated based on the bolt size. The app uses the following
38formula to calculate the cross-sectional area:
39
40
41      $A_s = π d^2 / 4$
42
43
44Where:
45
46      $A_s$ = Bolt cross-sectional area
47
48      $d$ = Bolt diameter
49
50The diameter of the bolt is calculated based on the bolt size. The app uses the following formula to calculate the
51diameter:
52
53|       Bolt Size |   Diameter (mm) |
54| ----------------------------|---------------------|
55|       M6 |   6 |
56|       M8 |   8 |
57|       M10 |   10 |
58|       M12 |   12 |
59|       M16 |   16 |
60|       M20 |   20 |
61|       M24 |   24 |
62"""
63
64UNITS = {
65 "A_s": "m²",
66 "F_shear": "N",
67 "F_tension": "N",
68 "f_ub": "MPa",
69 "pitch": "mm",
70}
71
72FORCE_RESPONSES = ["F_shear", "F_tension"]
73STRESS_RESPONSES = ["f_ub"]
74
75image = Image.BOLT.get_div(style={"width": "50%", "float": "right"})
76
77right_content = [
78 html.H4("About"),
79 html.P([image, dcc.Markdown(text, mathjax=True)]),
80]
81
82style_cell_conditional = [
83 {"if": {"column_id": "Name"}, "width": "20%", "textAlign": "left"},
84 {"if": {"column_id": "Units"}, "width": "20%", "textAlign": "left"},
85]
86
87PLACEHOLDER_DATA_COLUMNS = [{"name": "", "id": ""}]
88PLACEHOLDER_DATA = [{"": "No data available"}]
89
90parameter_table = dash_table.DataTable(
91    id="parameters_table", data=PLACEHOLDER_DATA, style_cell_conditional=style_cell_conditional
92)
93responses_table = dash_table.DataTable(
94    id="responses_table", data=PLACEHOLDER_DATA, style_cell_conditional=style_cell_conditional
95)
96
 97GRAPH_LAYOUT = {"plot_bgcolor": "rgba(0,0,0,0)", "paper_bgcolor": "rgba(0,0,0,0)"}
 98GRAPH_STYLE = {"width": "100%"}
 99HIDDEN_GRAPH_STYLE = {**GRAPH_STYLE, "display": "none"}
100
101parameter_graph = dcc.Graph(id="parameter-graph", style=HIDDEN_GRAPH_STYLE, responsive=True)
102response_graph = dcc.Graph(id="responses-graph", style=HIDDEN_GRAPH_STYLE, responsive=True)
103
104graph_holder = html.Div(
105    [parameter_graph, response_graph], style={"display": "flex", "flex-direction": "row", "size": "100%"}
106)
107
108left_content = [
109    html.H4("Data Tables"),
110    parameter_table,
111    html.Br(),
112    responses_table,
113    html.Br(),
114    html.H4("Data Graphs"),
115    graph_holder,
116]
117
118left_side = html.Div(left_content, style={"display": "flex", "flex-direction": "column", "width": "45%"})
119divider = html.Div(style={"display": "flex", "flex-direction": "column", "width": "5%"})
120right_side = html.Div(right_content, style={"display": "flex", "flex-direction": "column", "width": "45%"})
121
122layout = html.Div([left_side, divider, right_side], style={"display": "flex", "flex-direction": "row"})
123
124
125@callback(
126    Output("parameters_table", "data"),
127    Output("parameters_table", "columns"),
128    Trigger(WebsocketStreamListeners.ACTOR_DATA.value, "message"),
129    State("url", "pathname"),
130)
131def update_parameter_table(pathname):
132    project = DashClient[Bolt_AppSolution].get_project(pathname)
133    data_access = DataAccess(project)
134    osl_project_tree = data_access.get_project_tree()
135
136    if osl_project_tree.is_uninitialized:
137        return PLACEHOLDER_DATA, PLACEHOLDER_DATA_COLUMNS
138
139    actors = osl_project_tree.find_nodes_by_name("Sensitivity")
140
141    if not actors:
142        return PLACEHOLDER_DATA, PLACEHOLDER_DATA_COLUMNS
143
144    actor = actors[0]
145    hids = data_access.monitoring_data.get_actor_states_ids(actor.uid)
146
147    if not hids.states_ids:
148        # No data available yet
149        return PLACEHOLDER_DATA, PLACEHOLDER_DATA_COLUMNS
150
151    actor_and_hid = ActorAndHid(actor_uid=actor.uid, hid=hids.states_ids[0])
152    design_points = data_access.monitoring_data.get_design_points(actor_and_hid)
153    parameter_data = design_points.to_dict_by_states(DesignFields.PARAMETERS)
154    parameter_frame = pd.DataFrame(parameter_data)
155    return parameter_frame.to_dict("records"), [{"name": i, "id": i} for i in parameter_frame.columns]
156
157
158@callback(
159    Output("responses_table", "data"),
160    Output("responses_table", "columns"),
161    Trigger(WebsocketStreamListeners.ACTOR_DATA.value, "message"),
162    State("url", "pathname"),
163)
164def update_response_table(pathname):
165    project = DashClient[Bolt_AppSolution].get_project(pathname)
166    data_access = DataAccess(project)
167    osl_project_tree = data_access.get_project_tree()
168
169    if osl_project_tree.is_uninitialized:
170        return PLACEHOLDER_DATA, PLACEHOLDER_DATA_COLUMNS
171
172    actors = osl_project_tree.find_nodes_by_name("Sensitivity")
173
174    if not actors:
175        return PLACEHOLDER_DATA, PLACEHOLDER_DATA_COLUMNS
176
177    actor = actors[0]
178    hids = data_access.monitoring_data.get_actor_states_ids(actor.uid)
179
180    if not hids.states_ids:
181        # No data available yet
182        return PLACEHOLDER_DATA, PLACEHOLDER_DATA_COLUMNS
183
184    actor_and_hid = ActorAndHid(actor_uid=actor.uid, hid=hids.states_ids[0])
185    design_points = data_access.monitoring_data.get_design_points(actor_and_hid)
186
187    response_names = design_points.get_field_names(DesignFields.RESPONSES)
188    response_data = design_points.to_dict_by_states(DesignFields.RESPONSES)
189    response_frame = pd.DataFrame(response_data)
190    # Insert the units of measure
191    response_frame.insert(1, "Units", [UNITS.get(field_name, "") for field_name in response_names])
192    return response_frame.to_dict("records"), [{"name": i, "id": i} for i in response_frame.columns]
193
194
195@callback(
196    Output("parameter-graph", "figure"),
197    Output("parameter-graph", "style"),
198    Trigger(WebsocketStreamListeners.ACTOR_DATA.value, "message"),
199    State("url", "pathname"),
200)
201def update_stress_graph(pathname):
202    project = DashClient[Bolt_AppSolution].get_project(pathname)
203    data_access = DataAccess(project)
204    osl_project_tree = data_access.get_project_tree()
205
206    if osl_project_tree.is_uninitialized:
207        return {}, HIDDEN_GRAPH_STYLE
208
209    actors = osl_project_tree.find_nodes_by_name("Sensitivity")
210
211    if not actors:
212        return {}, HIDDEN_GRAPH_STYLE
213
214    actor = actors[0]
215    hids = data_access.monitoring_data.get_actor_states_ids(actor.uid)
216
217    if not hids.states_ids:
218        # No data available yet
219        return {}, HIDDEN_GRAPH_STYLE
220
221    actor_and_hid = ActorAndHid(actor_uid=actor.uid, hid=hids.states_ids[0])
222    design_points = data_access.monitoring_data.get_design_points(actor_and_hid)
223    data = design_points.to_dict_by_keys(DesignFields.RESPONSES)
224    states = design_points.get_states()
225    data = [
226        {
227            "x": states,
228            "y": data[field_name],
229            "type": "bar",
230            "name": field_name,
231        }
232        for field_name in STRESS_RESPONSES
233    ]
234    layout = {
235        **GRAPH_LAYOUT,
236        "title": "Stresses",
237        "xaxis": {"title": "Design", "tickmode": "array", "tickvals": states, "ticktext": states},
238        "yaxis": {"title": "Stress (MPa)"},
239    }
240    figure = {"data": data, "layout": layout}
241    return figure, GRAPH_STYLE
242
243
244@callback(
245    Output("responses-graph", "figure"),
246    Output("responses-graph", "style"),
247    Trigger(WebsocketStreamListeners.ACTOR_DATA.value, "message"),
248    State("url", "pathname"),
249)
250def update_responses_graph(pathname):
251    project = DashClient[Bolt_AppSolution].get_project(pathname)
252    data_access = DataAccess(project)
253    osl_project_tree = data_access.get_project_tree()
254
255    if osl_project_tree.is_uninitialized:
256        return {}, HIDDEN_GRAPH_STYLE
257
258    actors = osl_project_tree.find_nodes_by_name("Sensitivity")
259
260    if not actors:
261        return {}, HIDDEN_GRAPH_STYLE
262
263    actor = actors[0]
264    hids = data_access.monitoring_data.get_actor_states_ids(actor.uid)
265
266    if not hids.states_ids:
267        # No data available yet
268        return {}, HIDDEN_GRAPH_STYLE
269
270    actor_and_hid = ActorAndHid(actor_uid=actor.uid, hid=hids.states_ids[0])
271    design_points = data_access.monitoring_data.get_design_points(actor_and_hid)
272    data = design_points.to_dict_by_keys(DesignFields.RESPONSES)
273    states = design_points.get_states()
274    data = [
275        {
276            "x": states,
277            "y": data[field_name],
278            "type": "bar",
279            "name": field_name,
280        }
281        for field_name in FORCE_RESPONSES
282    ]
283    layout = {
284        **GRAPH_LAYOUT,
285        "title": "Forces",
286        "xaxis": {"title": "Design", "tickmode": "array", "tickvals": states, "ticktext": states},
287        "yaxis": {"title": "Force (N)"},
288    }
289    figure = {"data": data, "layout": layout}
290    return figure, GRAPH_STYLE